
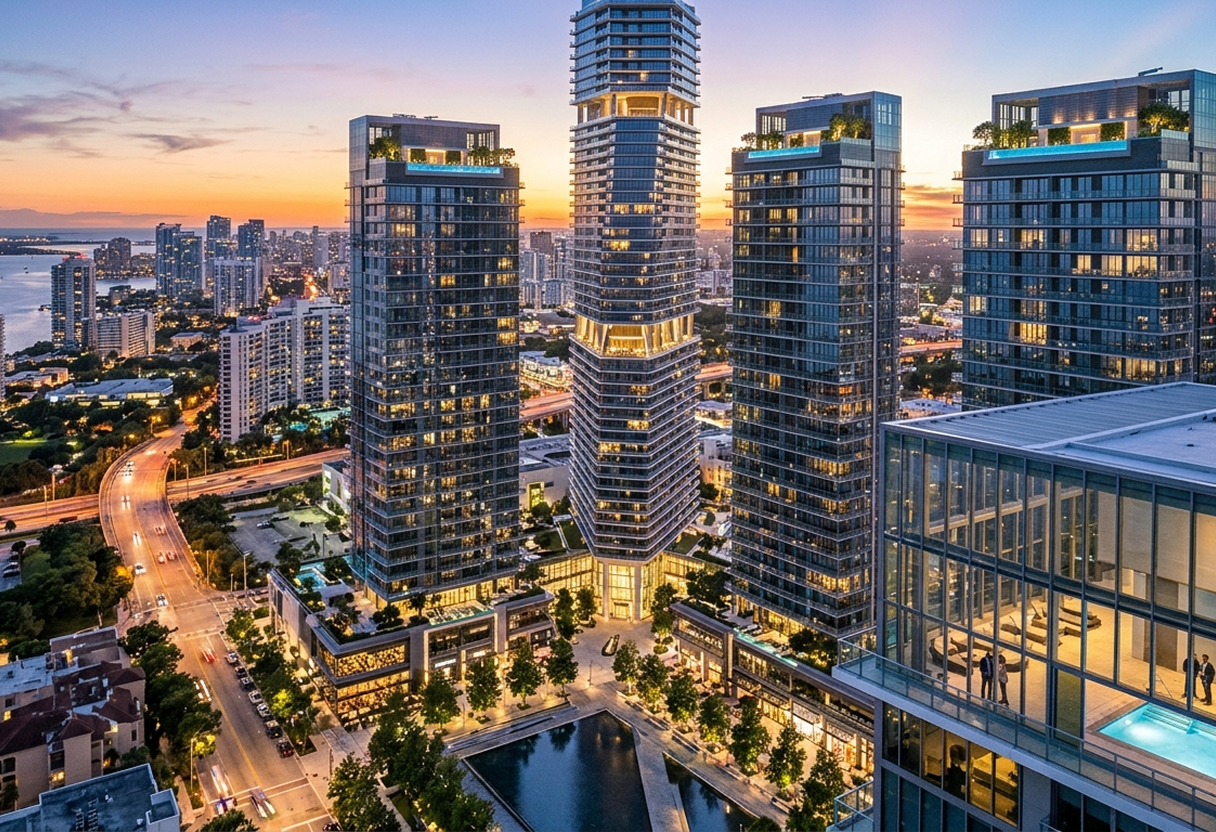
India’s luxury branded residences market has moved beyond a niche segment. The Luxury Branded Residences – Market Overview & Performance Analysis (Sep-2026) from CRE Matrix tracks how supply, demand, transaction value, pricing, and brands have shaped the market through 2026 YTD.
Developers launched 3,181 units in 2025, up from 1,015 in 2024. They added another 1,975 units in 2026 YTD. Buyers absorbed 68% of cumulative supply.
Luxury Branded Residences Scale Across 10 Key Markets
The market has expanded beyond traditional luxury housing hubs, with branded residences now spanning 10 key Indian markets. CRE Matrix’s coverage includes Delhi NCR, Mumbai, Alibaug (Raigad), Pune, Hyderabad, Kolkata, Bengaluru, Chennai, Bhubaneswar and Lonavala.
Delhi NCR has the largest project base with 15 projects. Mumbai and Pune follow with 6 projects each, while Kolkata has 3. Hyderabad and Bengaluru have 2 projects each, and Alibaug (Raigad), Lonavala, Chennai and Bhubaneswar have 1 project each.
Supply remains concentrated in the North and West. North India accounts for 47% of total supply, compared with 31% in the West, 13% in the East and 8% in the South.
India Leads APAC Luxury Residential Value
India ranks fourth in APAC by branded-residence supply, with 10,450 units in 2026 YTD. Vietnam leads with 15,800 units, followed by Thailand at 13,900 and the Philippines at 12,300.
The remaining markets recorded Malaysia at 5,800 units, South Korea at 4,100, Japan at 1,900, Cambodia at 1,400, Indonesia at 1,200, China at 1,100, Singapore at 1,000, Sri Lanka at 400, Maldives at 300, and Taiwan at 300.
India ranks first by market value at $9.7B, ahead of Vietnam at $8.0B, Thailand at $6.3B, South Korea at $5.8B, the Philippines at $3.8B, Japan at $3.0B, Singapore at $2.2B, Malaysia at $1.9B, Maldives at $1.8B, Indonesia at $1.4B, China at $0.7B, Taiwan at $0.3B, Sri Lanka at $0.3B and Cambodia at $0.2B.
India captures 21% of the $45.3B APAC value, compared with 15% of units. Its average value per unit reaches $0.93M, 1.8x Vietnam’s $0.51M.
Supply and Demand Show Strong Growth
The market saw a sharp acceleration in supply after 2023. Annual launches rose from 1,015 units in 2024 to 3,181 units in 2025, marking a 3.1x increase and the largest annual addition on record. The market added another 1,975 units in 2026 YTD.
Demand also strengthened significantly. Buyers absorbed 2,091 units in 2025, followed by 1,616 units in 2026 YTD, indicating continued traction as supply expanded.
The report records a ~21% supply CAGR from 2018–2026 YTD. Developers launched 5,156 units during 2025–2026 YTD, twice the 2,607 units launched during 2018–2024. From 2018 to 2024, supply never crossed 1,015 units in a year, while demand reached 2,545 units against 2,607 units launched.
Transaction Value Accelerates
Transaction value increased from ₹3,059 Cr in 2018 to ₹16,942 Cr in 2025, reflecting a significant acceleration in market activity.
The report records ₹11,717 Cr in 2026 YTD and estimates another ₹5,400 Cr for October–December, taking the estimated 2026 full-year value to ₹17,117 Cr. Cumulative transaction value stands at ₹47,278 Cr for 2018–2026 YTD, with a value CAGR of ~49% between 2019 and 2025.
Regional Trends Shape Luxury Homes
North India accounts for 4,939 of 10,452 units, or 47%. West follows with 3,240 units, or 31%. East accounts for 1,397 units, or 13%, while South accounts for 876 units, or 8%.
West launched 2,288 of 2,689 pre-2018 units, representing 85% of that stock. North launched 3,891 of the 5,156 units in the 2025–26 YTD wave, representing 75%.
Non-hospitality brands account for 7,636 units, or 73% of supply. Fashion TV leads with 2,567 units, followed by Trump at 1,740, Westin (Marriott) at 1,464, YOO at 1,100, Elie Saab at 979, Tonino Lamborghini at 812, The Leela at 389, Ritz-Carlton (Managed by Marriott) at 284, Jacob & Co. at 250, Sarovar at 232, Versace Home at 188, Taj (IHCL) at 163, The Fern / Series by Marriott at 150, The Park at 69, Four Seasons at 46 and Trident (Oberoi Group) at 19.
Hospitality brands account for 2,816 units. Westin, The Fern and Ritz-Carlton together hold 1,898 units, or 67% of hospitality supply.
Luxury Residence Ticket Sizes Vary by Region
West records the highest weighted-average ticket at ₹10.8 Cr, followed by North at ₹9.5 Cr, South at ₹7.3 Cr, and East at ₹2.6 Cr.
The pan-India weighted-average ticket reaches ₹8.81 Cr across 10,452 units. West’s ₹10.8 Cr ticket stands at 4.2x East’s ₹2.6 Cr ticket. North and West together account for 78% of units.
Branded Luxury Properties Command a 25–44% Premium
Branded luxury properties command a 25–44% premium over comparable catchment projects across seven cities.
Pune records the highest premium at 44%, followed by Kolkata at 42%, Bengaluru at 32%, Gurugram at 29%, Noida at 26%, Mumbai at 26% and Hyderabad at 25%.
The seven-city average premium stands at ~32%. Pune and Kolkata sit 10–12 percentage points above that average. Pune’s 44% premium reaches 1.8x Hyderabad’s 25%. Hyderabad, Mumbai, Noida, and Gurugram form a 25–29% band, while Bengaluru matches the average at 32%.
3 & 4+ BHK homes account for 82% of total supply.
The report shows Studio at 1%, 1 BHK at 4%, 2 BHK at 14%, 3 BHK at 38%, and 4 BHK+ at 43%. The 4 BHK+ format forms the single largest category.
Together, 3 BHK and 4 BHK+ homes account for 82% of the 10,452 units, or 8,543 units. Studio and 1 BHK homes account for only 5%. West differs from other regions, with 2 BHK units forming 37% of its supply. South allocates two-thirds of its units to 4 BHK+, while East builds nothing below 3 BHK.
Luxury Housing in South India Leans Towards Larger Formats
South India records the largest average home sizes across key luxury configurations, with its 3 BHK homes averaging 2,269 sq ft and 4 BHK+ homes reaching 3,709 sq ft, the largest in size. West follows closely for larger homes, with its 4 BHK+ homes averaging 3,674 sq ft.
In comparison, North’s 4 BHK+ homes average 2,926 sq ft, while East records significantly smaller sizes in the larger configurations. The data highlights a clear preference for more spacious luxury homes in South India, particularly in the 3 BHK and 4 BHK+ segments.
Luxury Housing Supply Skews Towards a Few Key Developers
The branded residences market shows a high concentration of supply among leading developers, with the top 10 accounting for 8,177 of 10,452 units, or 78% of total supply. M3M India, Smartworld Developers and Tribeca Developers lead the market with a combined 1,647 units, representing 16% of total supply, followed by Whiteland Corporation with 1,464 units.
Together, the top three developers account for 4,095 units, or 39% of total supply, highlighting the strong presence of established players in India’s branded residences segment, with M3M India emerging as a key contributor to the market’s supply pipeline.
What the Luxury Residential Market Signals
The report shows a rapidly scaling segment with strong absorption, rising transaction value, and a clear preference for larger luxury homes. North India now leads supply, non-hospitality brands dominate the brand mix, and ten developers control 78% of branded supply.
For developers, brands, and investors, these figures provide a structured view of where luxury branded residences stand across India in 2026 YTD.
Explore the latest trends in India’s luxury branded residences market, from supply and demand to pricing and brand performance with CRE Matrix.